 |
 |
| Year ended 31 December 2005 £m |
Year ended 31 December 2004 £m |
|
|---|---|---|
| Revenue (including joint ventures and associates) |
2,936 | 1,267 |
| Profit from operations | ||
| Excluding exceptional items | 501 | 222 |
| Including exceptional items | 611 | 233 |
| Profit before tax | ||
| Excluding exceptional items | 299 | 145 |
| Including exceptional items | 419 | 129 |
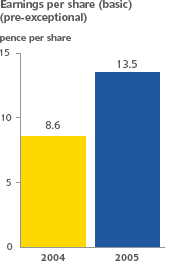
| Earnings per share (EPS) in pence | ||
| Basic excluding exceptional items | 13.5p | 8.6p |
| Basic including exceptional items | 19.4p | 7.5p |
| Dividend per share (DPS) in pence | 4.5p | 2.5p |
| Cash generated from operations | 512 | 208 |
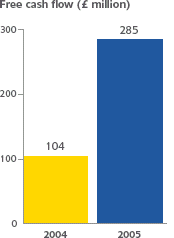
| Free cash flow - see Group cash flow table | 285 | 104 |
| Capital expenditure | ||
| Maintenance | (72) | (59) |
| Growth | (188) | (158) |
| Major acquisition expenditure | ||
| Edison Mission Energy assets | - | 1,073 |
| Turbogás | - | 135 |
| Saltend | 495 | - |
| As at 31 December 2005 £m |
As at 31 December 2004 £m |
|
|---|---|---|
| Net assets | 2,375 | 2,058 |
| Net debt | 2,979 | 2,745 |
| Gearing | 125% | 133% |
| Debt capitalisation | 56% | 57% |

